PivotTable
PivotTable
Learning Objectives:
- Learning the purpose of PivotTables.
- Learning how to create a PivotTable in Excel.
PivotTable
PivotTable is a functionality in Excel that helps you organize and analyze large datasets. It allows you to add and remove values, perform calculations, and filter and sort data sets.Note: The data that you use needs to be in table format.
PivotTable Components
PivotTables have four main components:- Columns: Columns include a unique header that defines which data you are seeing listed downwards
- Rows: Data in the same row are related. The type of stats listed in that row is reader in the header in the columns.
- Filters: They are used to select which data you see.
- Values: Values are how you present the data.
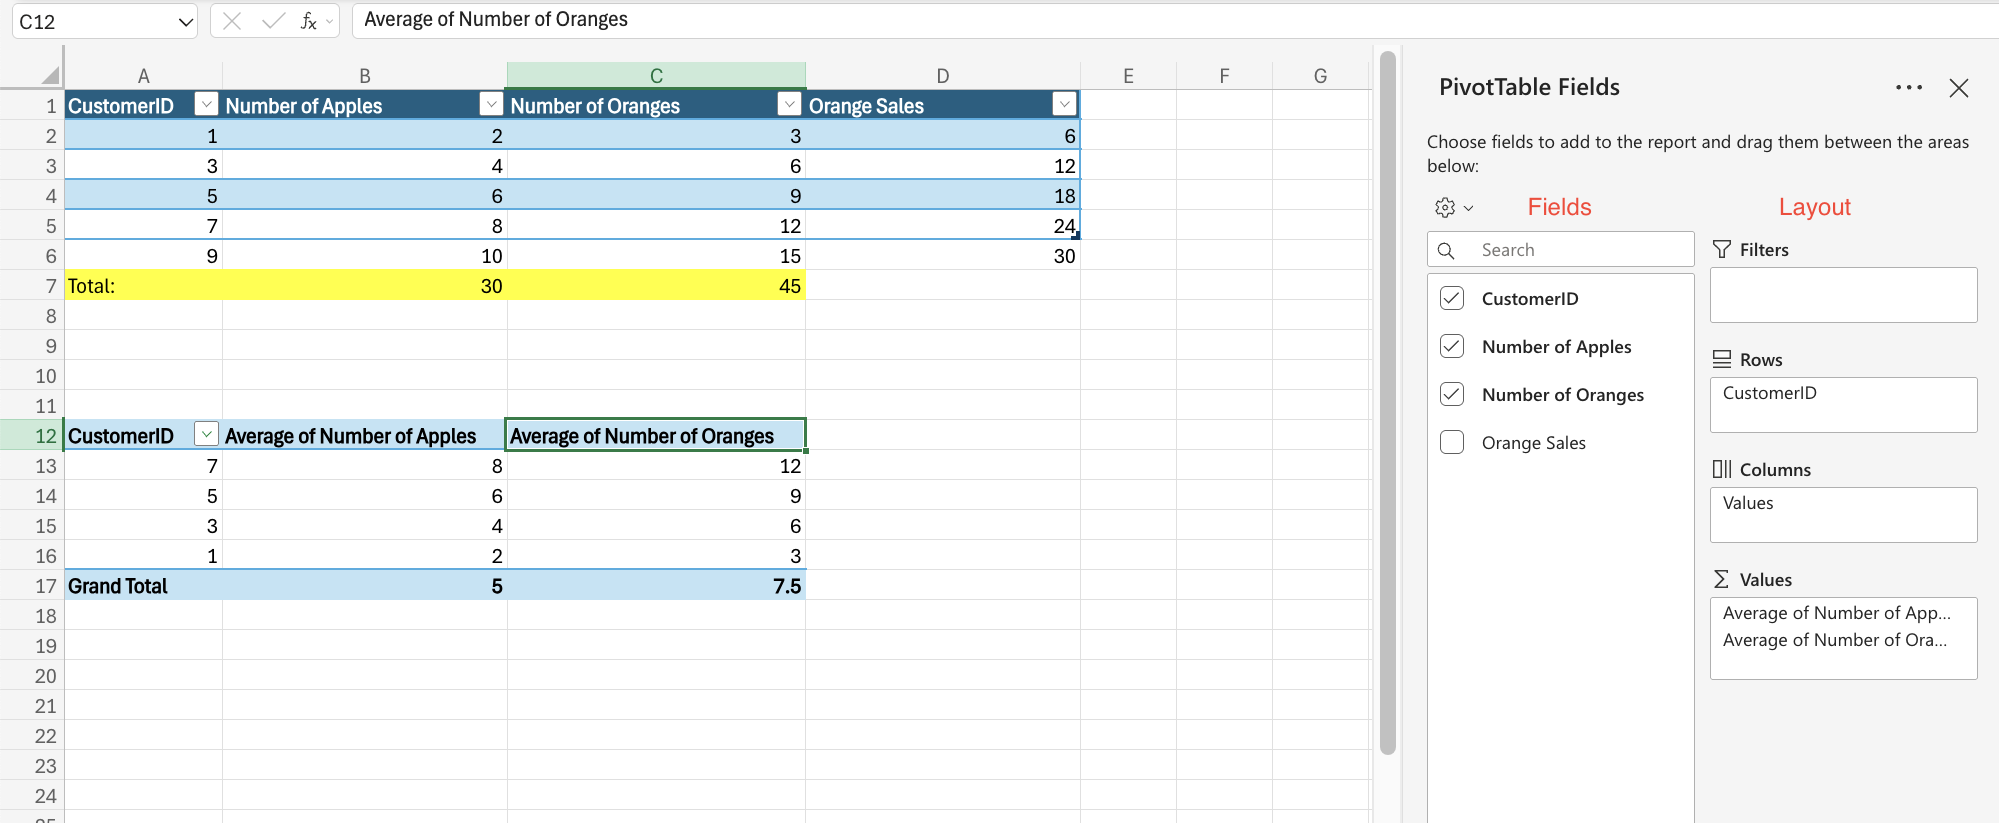
Fields and Layouts
The table is displayed based on your settings. The PivotTable Fields panel allows you to change how you see the data. The settings can be separated into two: Fields and Layout.Fields
Fields refers to the data points from your source table.Layouts
Layout alerts the way the four main components are displayed in the data.