Excel Charts
Excel Visualizations
Learning Objectives:
- Learning how to create charts in Excel.
Excel Charts
Charts are visual representations used to make data more understandable.Commonly created charts in Excel are:
- Pie chart
- Column chart
- Line chart
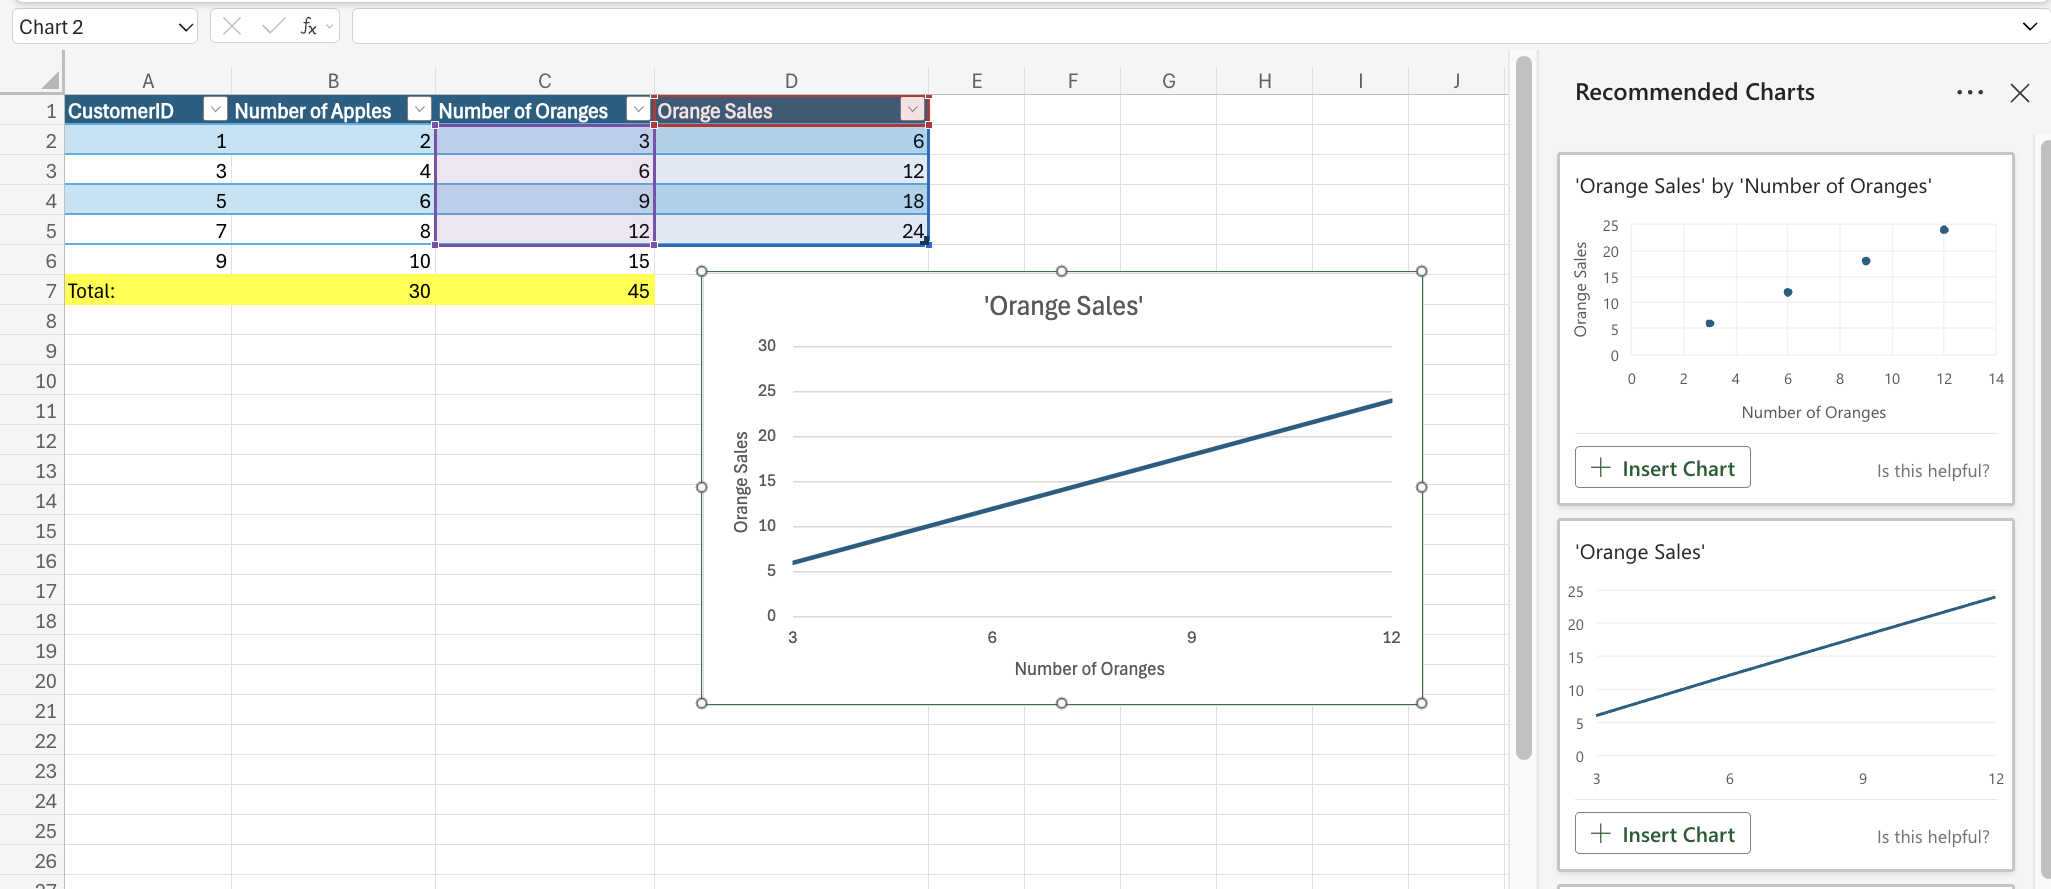
- Creating a Chart in Excel
To create a chart in Excel, select a range of cells and then click on the Insert menu and then choose the chart you would like to use to visualize the data.